1891: (March)
9-13th March 1891, easterly BLIZZARD**. Heavy, fine powdery SNOW and STRONG EASTERLY WINDS raged across SW England, southern England and Wales, with over half a million trees being blown down, as well as a number of telegraph poles.
On the 9th (and later?), GREAT SNOWSTORM in the west of England, trains buried for days: E-NE GALE, shipwrecks, many lives lost. ( 220 people dead; 65 ships foundered in the English Channel; 6000 sheep perished; countless trees uprooted; 14 trains stranded in Devon alone.) Although the West Country was the worst affected, southern England, the Midlands, and south Wales also suffered. SNOWDRIFTS were 'huge' around some houses in the London - would be accounted a most remarkable sight nowadays! A man was reported found dead at Dorking, Surrey, while SNOWDRIFTS of 3.5 metres were recorded at Dulwich, London and Dartmouth, Devon. At Torquay and Sidmouth, Devon over 30 cm of snow fell.
WHY DID WE GET SO MUCH SNOW?
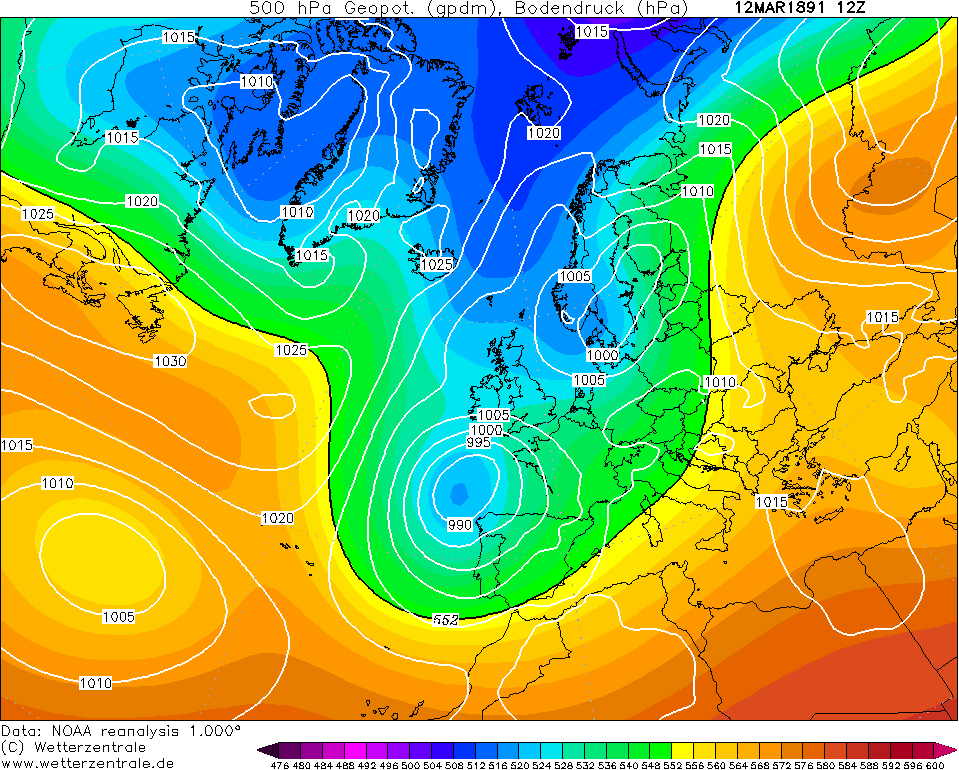
March started mild but on the 6th, a depression moved into Norway dragging down colder air across the UK. High pressure was intensifying in the Atlantic and the winds turned into the NE bringing very cold air. On the 9th, a depression moved into the Brest area of France and this engaged the colder air over the UK. Dry powdery snow fell across many parts of the West Country and this spread across other southern counties of England. On the 10th, the depression deepened and a severe easterly gale blew in the Channel and there was continous heavy snow and blizzards across southern counties of England. As the first Channel depression moved away, another one entered the Brest region and the snow and gales returned to the West Country again but this system moved into France rather than along the Channel and counties bordering the eastern part of the Channel missed the blizzards this time. By this stage, Cornwall and Devon were virtually cut off by enormous drifts and deep snow cover. It was estimated that Dartmoor had between 1 to 1 and a half metres of snow and snow depths of 15cm+ was reported south west of a line from Kent to Gwynedd.
**This may be the first time in the UK that the word 'blizzard' was used. Thought to derive from a German expression: " Der sturm kommt blitzartig", which translates as "The storm comes/came lightning-like".
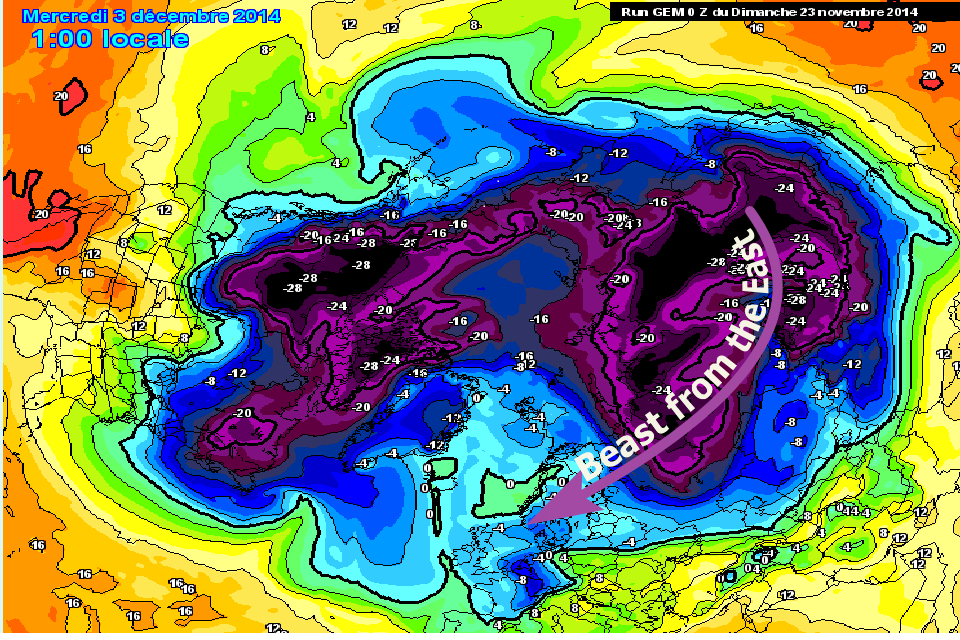
Cold air moving in from the east will bring an end to the above average temperatures we have enjoyed so far this winter, with the Metjeffuk.com is predicting a return of the beast from the east at the moment we are still waiting for this happen.
https://www.forbes.com/sites/jamestaylor/2015/02/09/top-10-global-warming-lies-that-may-shock-you/?sh=2babd29d53a5
What is the "The Beast from the East"
In 2011 with cold winds from Siberia Metjeffuk and a Dutch weather forecaster weather expert was having a fun on Twitter [Which was very different to what is today ] I named this very cold air The Beast From The East It wasn't until the winter of 2014 when cold air from Russia spread west it was a real beast so metjeffuk.com for the first time added #GFS images with the words "The Beast from the East" this later became famous It wasn't till the next severe winter of 2018 when again we had the beast back, February 2018, Great Britain and Ireland were affected by very cold air, again we named this the Beast from the East ( First named by Metjeffuk.com on the 3rd of December 2014 with images, All credits please to metjeffuk.com when naming the #Beast from the east) which brought widespread and unusually low temperatures with heavy snowfall to large areas. The cold spell was combined with Storm Emma,, which made landfall in southwest England and southern Ireland on 2 March.
This weather situation repeated itself on the weekend of 17 and 18 March, but was less severe than on the previous occasion due to the onset of spring. This briefer cold snap was given the name "Mini Beast from the East
What is a Sting jet
A sting jet is a core of strong winds which sometimes forms in rapidly deepening areas of low pressure and extends towards the ground.
What is a sting jet?
A sting jet is a small area of very intense winds (often 100mph or more) that can sometimes form in powerful weather systems crossing the UK. Relative to the size of the storm, the sting jet is narrow, often 30 miles across, and only lasts 3 to 4 hours.
Regardless, with gusts of wind exceeding 100 mph there is clearly still the risk of damage. The Great Storm of 1987 was a perfect example of this.
How does a sting jet form?
We know that warm air rises and cold air sinks; that’s what creates cloud and rain. It also helps to form areas of low pressure, sometimes turning them into storms. Areas of low pressure almost always have weather fronts as part of their structure, unless they’re a tropical storm. These fronts separate areas of warm and cold air and it’s their interaction that creates and develops wet and windy weather.
Close to the fronts there tends to be more focused streams of warm and cold air that run parallel to them. They are known as conveyor belts; the warm conveyor rises and the cold conveyor falls. These wrap around the area of low pressure and help develop it by feeding warm air and moisture into the system.
The cold conveyor brings its cold air from higher in the atmosphere and from being in a cold air mass. Sometimes it has help from rain and snow as they fall into it and evaporate. This change from liquid to gas requires heat, which is removed from the conveyor, cooling it further. Now we have even colder air falling along the conveyor, speeding up as it does so, like a rollercoaster taking the first drop.
As this wind reaches the surface it can often produce much stronger gusts would otherwise be made by the storm. However, the cold conveyor catches up with itself after a few hours and consumes the sting jet, keeping the length of time and area of potential damage quite small.
WHAT IS POLAR STRATOSPHERIC WARMING?
A stratospheric sudden warming is perhaps one of the most radical changes of weather that is observed on our planet. Within the space of a week, North Pole temperatures can increase by more than 50 K (90°F). For example, on 17 January 2009 the temperature at the North Pole near 30 km was about 200 K. Over a 5-day period, the temperature increased to 260 K (a change of 60 K or 108°F).
These stratospheric sudden warming are caused by atmospheric waves that originate in the troposphere. The waves are forced by the large-scale mountain systems of the northern hemisphere and the land-sea contrasts between the continents and oceans. The waves are also characterized by their very large scales, typically referred to as planetary-scale waves. The stratospheric wind structure filters the smaller scale waves, only allowing the planetary waves to propagate into the stratosphere. As the waves move upward into the stratosphere they have two effects: first they will often push the polar vortex away from the North Pole—bringing warmer mid latitude air pole ward, and second, they produce a downward motion field that also warms the polar region.
What is the Madden-Julian Oscillation?
The Madden-Julian Oscillation is characterised by an eastward spread of large regions of enhanced and suppressed tropical rainfall, mainly observed over the Indian and Pacific Ocean.
It was discovered in 1971 by Dr Roland Madden and Dr Paul Julian of the American National Centre for Atmospheric Research (NCAR), when they were studying tropical wind and pressure patterns. They observed regular oscillations in winds between Singapore and Canton Island in the west central equatorial Pacific.
How does the MJO work?An area of enhanced tropical rainfall is first apparent over the western Indian Oceans, which spreads eastwards into the warm waters of the tropical Pacific. This pattern of tropical rainfall tends to lose its identity as it moves over the cooler waters of the eastern Pacific, before reappearing at some point over the Indian Ocean again.
A wet phase of enhanced convection (rainfall) is followed by a dry phase, where thunderstorm activity is suppressed (no rainfall). Each cycle lasts approximately 30-60 days and there are 8 phases.
The MJO phases
How does the MJO affect weather around the world? There are a number of ways in which the MJO influences world weather:
The Madden-Julian Oscillation is characterised by an eastward spread of large regions of enhanced and suppressed tropical rainfall, mainly observed over the Indian and Pacific Ocean.
It was discovered in 1971 by Dr Roland Madden and Dr Paul Julian of the American National Centre for Atmospheric Research (NCAR), when they were studying tropical wind and pressure patterns. They observed regular oscillations in winds between Singapore and Canton Island in the west central equatorial Pacific.
How does the MJO work?An area of enhanced tropical rainfall is first apparent over the western Indian Oceans, which spreads eastwards into the warm waters of the tropical Pacific. This pattern of tropical rainfall tends to lose its identity as it moves over the cooler waters of the eastern Pacific, before reappearing at some point over the Indian Ocean again.
A wet phase of enhanced convection (rainfall) is followed by a dry phase, where thunderstorm activity is suppressed (no rainfall). Each cycle lasts approximately 30-60 days and there are 8 phases.
The MJO phases
- Phase 1 – Enhanced convection (rainfall) develops over the western Indian Ocean.
- Phase 2 and 3 – Enhanced convection (rainfall) moves slowly eastwards over Africa, the Indian Ocean and parts of the Indian subcontinent.
- Phase 4 and 5 – Enhanced convection (rainfall) has reached the Maritime Continent (Indonesia and West Pacific)
- Phase 6, 7 and 8 – Enhanced rainfall moves further eastward over the western Pacific, eventually dying out in the central Pacific.
- The next MJO cycle begins.
How does the MJO affect weather around the world? There are a number of ways in which the MJO influences world weather:
- The MJO creates favourable conditions for tropical cyclone activity, which makes the MJO important to monitor during the Atlantic hurricane season.
- The enhanced rainfall phase of the MJO can also bring the onset of the Monsoon seasons around the globe. Conversely, the suppressed convection phase can delay the onset of the Monsoon season.
- There is evidence that the MJO influences the El Nino Southern Oscillation (ENSO) cycle. It does not cause El Nino or La Nina, but it can contribute to the speed of development and intensity of El Nino and La Nina episodes. The MJO appears to be more active during neutral and weak ENSO years.
- There is also evidence to suggest that the MJO can influence the onset of a Sudden Stratospheric Warming (SSW) event.
- When the MJO is in its active phase over Indonesia and the West Pacific, it tends to drive a negative North Atlantic Oscillation (NAO) 2 to 3 weeks later.
- A positive NAO index tends to be preceded by phase 3 and 4 of the MJO, which brings milder and wetter weather across the UK.
- A negative NAO index tends to be preceded by phase 6 and 7, which influences a ‘blocked’ weather pattern and is often associated with colder and drier weather across the UK.
- The timescale of the MJO having an influence on North Atlantic weather regimes is usually 10 to 12 days.
- Source UK Metoffice
An MIT PhD exposes who will profit from the “Climate Change” HOAX & why it was right that @realDonaldTrump pulled out of the pollution-incentivizing Paris Accords.
twitter.com/va_shiva/status/1176506786414825473
|
|
|
|
|
OUR PLANET /OUR UNIVERSE
|
NASA `WEATHER SCHOOL` VIDEO
WHAT IS THE POLAR VORTEX?
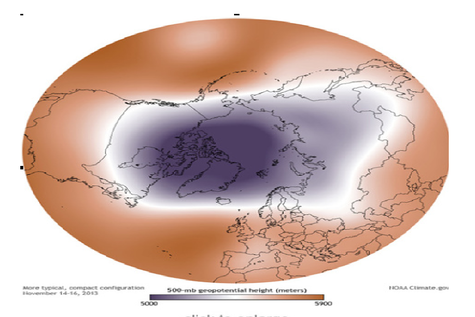
The polar vortex is a high altitude low-pressure system that hovers over the Arctic in winter. When the polar vortex is strong, it acts like a spinning bowl balanced on the top of the North Pole. The image (below) shows a strong phase of the polar vortex in mid-November 2013. Dark purple depicts the most frigid air tightly contained in an oval-shaped formation inside the invisible bowl. The light purple line forming the outermost boundary of the cold Arctic air is the jet stream in its normal west-to-east pattern.
WHAT IS POLAR STRATOSPHERIC WARMING?
A stratospheric sudden warming is perhaps one of the most radical changes of weather that is observed on our planet. Within the space of a week, North Pole temperatures can increase by more than 50 K (90°F). For example, on 17 January 2009 the temperature at the North Pole near 30 km was about 200 K. Over a 5-day period, the temperature increased to 260 K (a change of 60 K or 108°F).
These stratospheric sudden warming are caused by atmospheric waves that originate in the troposphere. The waves are forced by the large-scale mountain systems of the northern hemisphere and the land-sea contrasts between the continents and oceans. The waves are also characterized by their very large scales, typically referred to as planetary-scale waves. The stratospheric wind structure filters the smaller scale waves, only allowing the planetary waves to propagate into the stratosphere. As the waves move upward into the stratosphere they have two effects: first they will often push the polar vortex away from the North Pole—bringing warmer midlatitude air pole ward, and second, they produce a downward motion field that also warms the polar region.
North Atlantic Oscillation (NAO)
I define the NAO as the first (varimax rotated) EOF of standardized daily 500 hPa height anomalies in an extended North Atlantic domain (20N-70N, 135W-45E) from 1979 through 2008. This pattern, shown below, is then projected onto recent and forecast data to create the index. The index is standardized by the mean and standard deviation of the base index (again, 1979 through 2008), which is just the first PC. Note that my definition is similar to, but not the same as, CPC’s definition. My index correlates with theirs at roughly r = 0.76.
Arctic Oscillation (AO)
I define the AO as the first (unrotated) EOF of standardized daily 700 hPa height anomalies poleward of 20N from 1979 through 2008. This pattern, shown below, is then projected onto recent and forecast data to create the index.
Jeff Jacobs
Metjeffuk.com
Whatever your weather enjoy it! -----------------------------------------------------------------------------------------------------------------------------------
WHAT IS THE POLAR VORTEX?
The polar vortex is a high altitude low-pressure system that hovers over the Arctic in winter. When the polar vortex is strong, it acts like a spinning bowl balanced on the top of the North Pole. The image (below) shows a strong phase of the polar vortex in mid-November 2013. Dark purple depicts the most frigid air tightly contained in an oval-shaped formation inside the invisible bowl. The light purple line forming the outermost boundary of the cold Arctic air is the jet stream in its normal west-to-east pattern.
WHAT IS POLAR STRATOSPHERIC WARMING?
A stratospheric sudden warming is perhaps one of the most radical changes of weather that is observed on our planet. Within the space of a week, North Pole temperatures can increase by more than 50 K (90°F). For example, on 17 January 2009 the temperature at the North Pole near 30 km was about 200 K. Over a 5-day period, the temperature increased to 260 K (a change of 60 K or 108°F).
These stratospheric sudden warming are caused by atmospheric waves that originate in the troposphere. The waves are forced by the large-scale mountain systems of the northern hemisphere and the land-sea contrasts between the continents and oceans. The waves are also characterised by their very large scales, typically referred to as planetary-scale waves. The stratospheric wind structure filters the smaller scale waves, only allowing the planetary waves to propagate into the stratosphere. As the waves move upward into the stratosphere they have two effects: first they will often push the polar vortex away from the North Pole—bringing warmer mid latitude air pole ward, and second, they produce a downward motion field that also warms the polar region.
|
|
YOU MUST WATCH THIS VIDEO FROM THE COSMOS NEWS
|
ALL ABOUT WEATHER
The Pacific Decadal Oscillation (PDO)
WHAT IS THE NAO ?
The North Atlantic Oscillation (NAO) index is based on the surface sea-level pressure difference between the Subtropical (Azores) High and the Subpolar Low. The positive phase of the NAO reflects below-normal heights and pressure across the high latitudes of the North Atlantic and above-normal heights and pressure over the central North Atlantic, the eastern United States and western Europe. The negative phase reflects an opposite pattern of height and pressure anomalies over these regions. Both phases of the NAO are associated with basin-wide changes in the intensity and location of the North Atlantic jet stream and storm track, and in large-scale modulations of the normal patterns of zonal and meridional heat and moisture transport, which in turn results in changes in temperature and precipitation patterns often extending from eastern North America to western and central Europe.
Strong positive phases of the NAO tend to be associated with above-normal temperatures in the eastern United States and across northern Europe and below-normal temperatures in Greenland and oftentimes across southern Europe and the Middle East. They are also associated with above-normal precipitation over northern Europe and Scandinavia and below-normal precipitation over southern and central Europe. Opposite patterns of temperature and precipitation anomalies are typically observed during strong negative phases of the NAO. During particularly prolonged periods dominated by one particular phase of the NAO, abnormal height and temperature patterns are also often seen extending well into central Russia and north-central Siberia. The NAO exhibits considerable interseasonal and interannual variability, and prolonged periods (several months) of both positive and negative phases of the pattern are common.
The NAO index is obtained by projecting the NAO loading pattern to the daily anomaly 500 millibar height field over 0-90°N. The NAO loading pattern has been chosen as the first mode of a Rotated Empirical Orthogonal Function (EOF) analysis using monthly mean 500 millibar height anomaly data from 1950 to 2000 over 0-90°N latitude.
For more information, please visit the Climate Prediction Center NAO page.
Pacific Decadal Oscillation (PDO) Period of Record Time series
Pacific Decadal Oscillation (PDO)
Period of Record Time series
North Atlantic Oscillation (NAO) Time series since 2000
North Atlantic Oscillation (NAO)
Time series since 2000
Click to visit the U.S. Department of Commerce Website Click to visit USA.gov Click to visit Ready.gov
NCDC
About NCDC
Site Map
